My Stock Investing Workflow: A Step-by-Step Guide
A common phrase I hear is “I want to invest in stocks but I don’t know how to start”. My usual reply to this is, “It’s not that hard to learn, just gotta start somewhere.”
For a while, I felt like people just didn’t want to put in the time and effort to learn. After all, there are so many free resources out there to help you get started.
These days I’m much more forgiving in my opinion. People just don’t have the time nor can afford to put in the effort to learn. They have jobs, families, relationships and so many other commitments to worry about.
I don’t blame them for not wanting to spend a couple of hours every day reading about liquidity ratios or whatnot. Especially when it’s not their area of expertise.
So here I am today, sitting down to write this. What can I contribute to this particularly difficult learning curve that hasn’t been said and written about already?
The Workflow
Here I will share my own workflow, the actual step by step process of what tabs and windows I open when I’m doing research, investing, and also monitoring my portfolio. Maybe it will help you in some way on your journey to learn how to invest.
Everyone has their own method of monitoring the stock market. Some people like to check their account daily, others maybe once a week.
I believe that if you’re able to get a comfortable workflow down, you’ll be more confident about approaching other aspects of stock investing.
There’s no one way of creating a workflow, find something that’s comfortable for you and suits your needs. Once you’ve tackled what to look for, everything else will naturally fall into place.
Step 1: Casual Monitoring
I’m more on-the-go these days and struggle to find time to properly monitor stocks on a trading platform. I rely on apps to help me with my trading and investment. At present these are the apps that I frequently use.
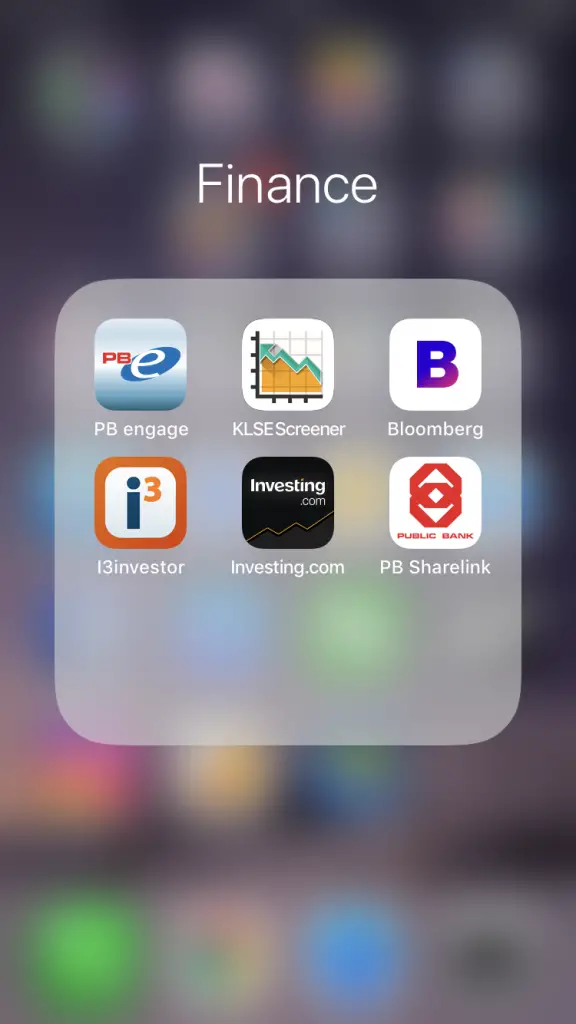
On a daily basis, I use the app KLSE Screener to monitor stocks that I am holding or am interested in.
Why KLSE Screener in particular? To be honest, I don’t really have a reason for that, I just like the interface. It’s quick, easy and doesn’t require me to log into my trading account.
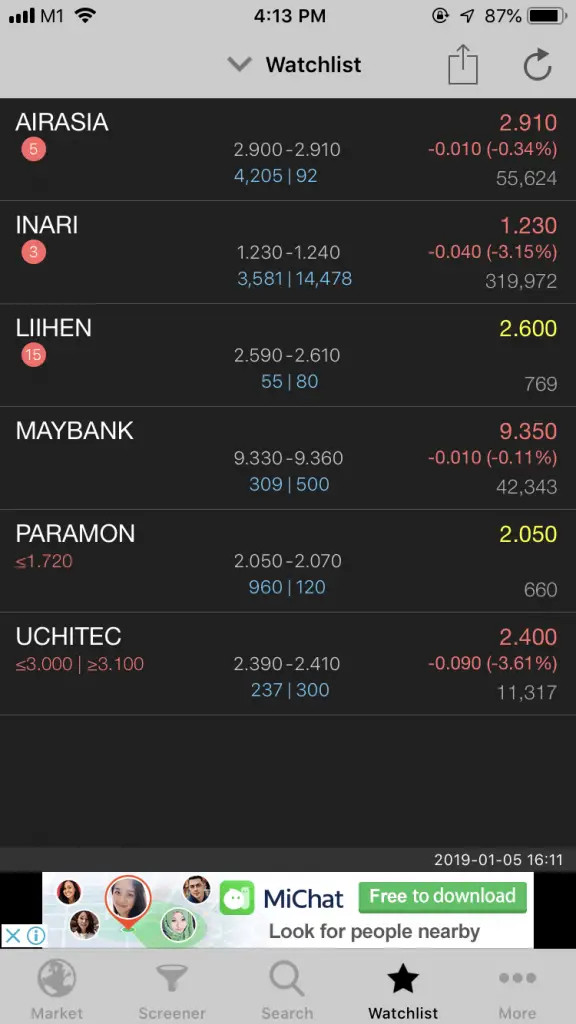
Since I only hold a small portfolio, I can remember the cost price of my stocks off the top of my head. This way I’m able to know whether I’m in a loss or gain position.
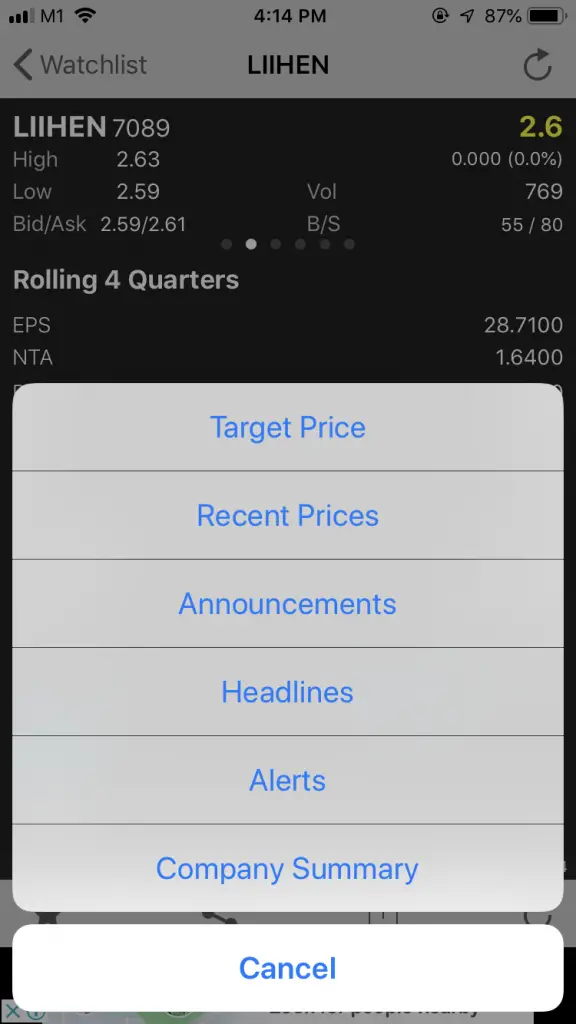
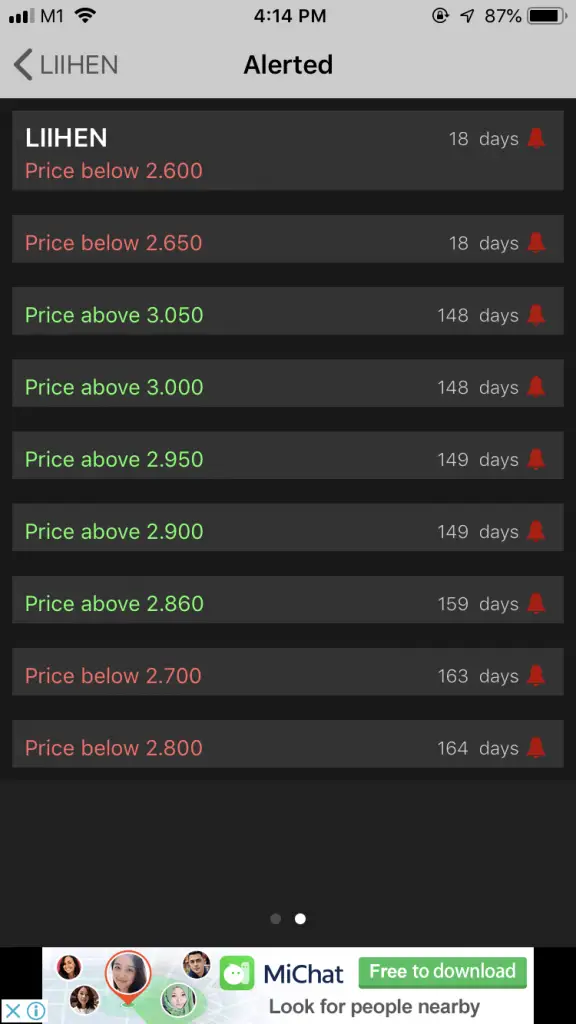
Another good thing about the KLSE Screener app is that you can create alerts for when a stock price hits a certain target. This is fairly convenient for people who have day jobs and can’t monitor the market constantly.
There are other apps that offer basically the same function. Although, these free tracking tools are not in real-time and they’re not suitable if you’re trying to do day-trading.
Step 2: Check the News
Most days, I try to catch up on as much economic, local political and business news as possible. This is to familiarise me to the economic sentiment and what’s going on in the world.
Are people confident and bullish? What has Trump gotten up to? Did Miley Cyrus really get married?
Other days, I open KLSE Screener and everything is RED. Lately, for example, INARI has taken a dive. When there’s a cause for concern, I will make further investigations.
Two go-to local publications I read are The Edge Markets and The Star Online.
Sometimes, both publications don’t report on stocks I’m looking at, so I will turn to Mr. Google Search Bar to see if any other news pops up on the interwebs.
Frequently, chances are you won’t find the news you’re looking for. Especially during volatile markets because every other investor is also facing a RED, RED, RED portfolio.
This is when it’s best to look at news in a sort of inverted pyramid strategy.
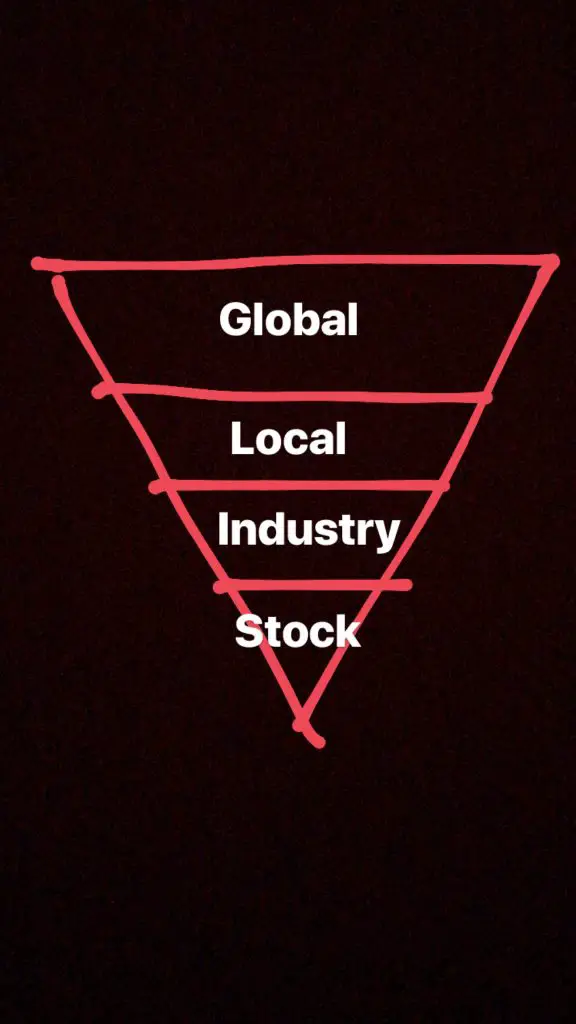
First, I start by looking for stock-specific news. Is there a bad quarter result announcement? Was there a change in management? Is there a new legal filing? Did they declare a special dividend?
If I can’t find anything about that stock that caused a major drop or uptick in price, then I’ll look for industry-specific news. Are there issues with demand or supply in the industry?
If there aren’t any industry-specific reports, then I start looking at the local, regional and global economic news. Did China do some shit? Did Trump say some idiotic thing? Is there a war or natural disaster somewhere?
Of course, you can look for news any which way you like too. It’s not a hard and fast rule. When trade wars happen, generally you’ll see RED across the board. A lot of news are interrelated as well. For example, some industries might be affected negatively by the US-China trade war while others might benefit from it. If oil prices drop, logistics and airline companies benefit from that, for instance.
The most crucial element of being an investor and what I tell people when they want to start investing is:
You gotta keep updated on news. You absolutely must.
There’s no way around it. It’s good to be a bit nosey about companies, CEOs, and politics because the world is constantly moving at a fast pace. When it comes to money, having exposure to current news will inform your investing decisions. It will also make you feel more confident and secure in those decisions.
Step 3: Check Blogs, Forums & Social Media
Ugh, this is my least favorite thing to do. But all those bloggers and forum comments have nuggets of information you don’t get on official news sources. There’s a lot of crap you gotta sift through but every so often you’ll get some really valuable insights well worth your time.
Klse.i3investor has a very active comment section and you can also check Facebook pages or Twitter feeds of prominent investment gurus and trading sifus.
For quality day-trading updates, I like reading Pelham Blue Fund.
For a period of time, I also used Bursa Marketplace. It has handy reports where it compiles researches from banks and comes up with a valuation number for the stock.
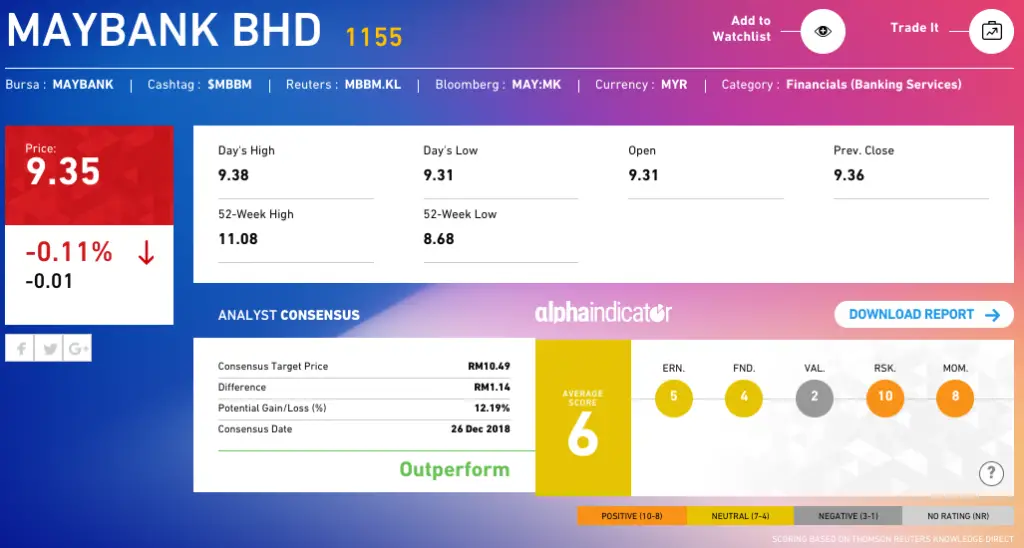
This helps give you an overview of what expectations researches have for stocks.
Step 4: Proper Monitoring
So far I’ve walked you through my daily process. Open KLSE Screener, check prices, read the news, investigate on Google, and weather through the online forums.
This usually takes up about 15 to 20 minutes of my time. It is doable for anyone who’s holding a long-term portfolio.
Let’s look into how I do proper monitoring of my investment account.
The Trading Platform
One drawback that stops people from investing in the stock market is navigating the actual trading platform itself.
On top of researching stocks, reading company profiles, learning about things like “liquidity ratios”, the actual process of learning how to use a trading platform can be daunting in itself.
Many brokerage houses offer courses on how to use a trading platform for free. They will show you what to look for, what some of the symbols mean, how the bid and auction process works and so on. If you want to learn the basics of using a trading platform, you can try out these sessions.
Just be careful, they might try to upsell you or get you to invest in shitty stocks just to earn your commission. On Bursa Malaysia, there are two companies who are trading platform vendors, ExcelForce and N2N Connect. There are other vendors like Rakuten. Basically, these companies supply the trading platforms to banks and brokerage firms to use.
Most of the banks have pretty much the same interface when it comes to a trading platform, just with minor differences like where the buttons are placed and what added features they offer.
When I have time to do a proper check, which is usually once a week, I will log into my trading account and check 6 sections:
Section 1: Portfolio Profit & Loss
I’ve done a few portfolio updates and this section is similar to those.
The first thing I always check when logging in is the Unrealized Profit & Loss section
It looks like this:
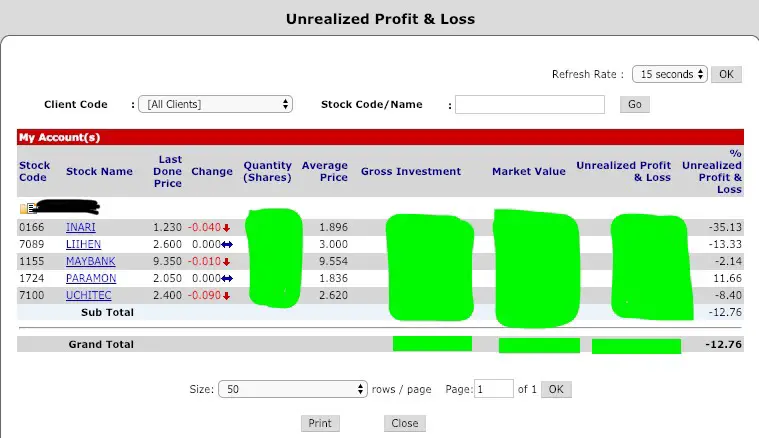
Sidenote: Yeah my stocks took a beating these past few weeks sigh.
This is where I assess the damage during pivotal market developments. When there’s more cause for concern (like that 35% paper loss on Inari) I do a repeat of Step 2 and Step 3 with further fundamental analysis.
Section 2: Account Balance & Dividend Credited
This particular section is mostly just to check if my money is still there and if there’s any extra that has come into my account from dividend payouts. I don’t check this section that often, mainly once a month.
Section 3: Company Announcement/News
This is kind of related to Step 2. Many trading platforms come with a section where you can view news and announcements released by the companies.
This section looks like this:
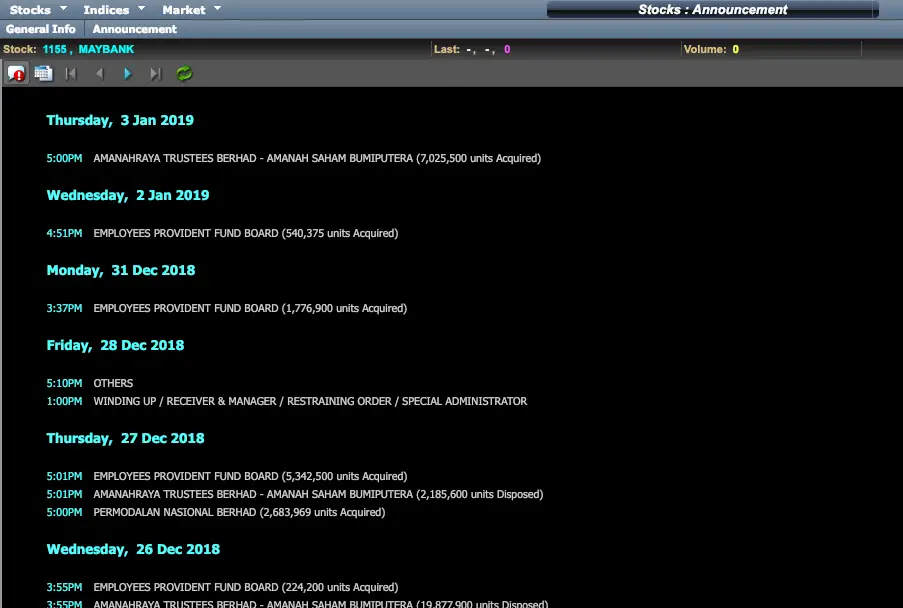
You can glean a lot of pertinent information from the Announcement section. Things like transactions done by the major shareholders, legal announcements, quarter result announcements, press releases and so on.
It’s a quick and easy way to get access to company-specific news on the platform.
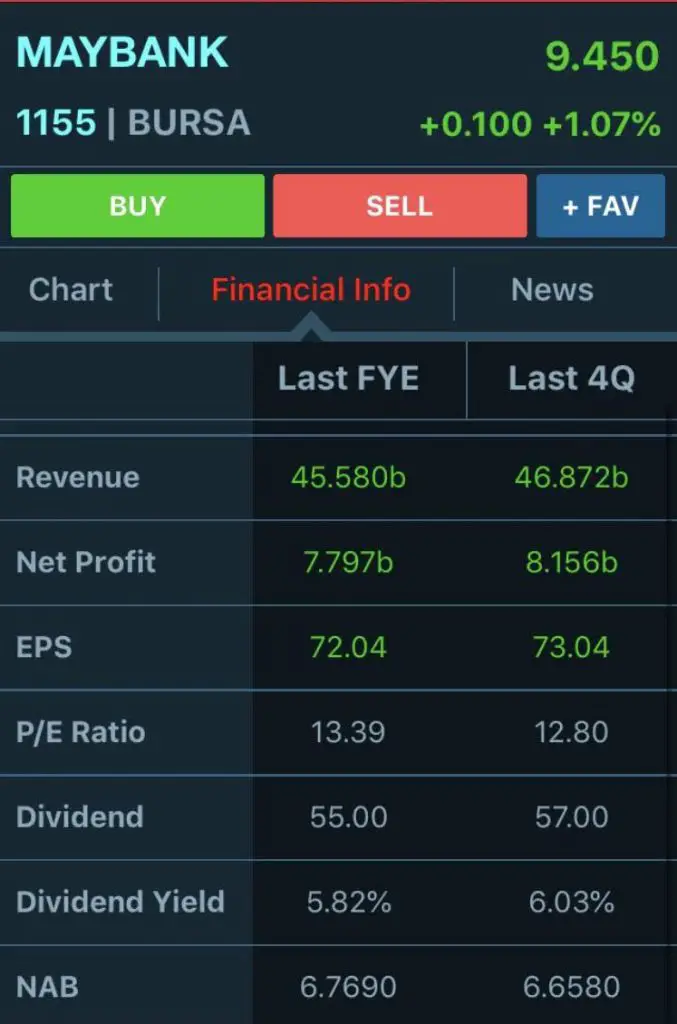
Section 4: Company Financial Statements
You can get information about the company’s revenue and profit from the Financial Statements section.
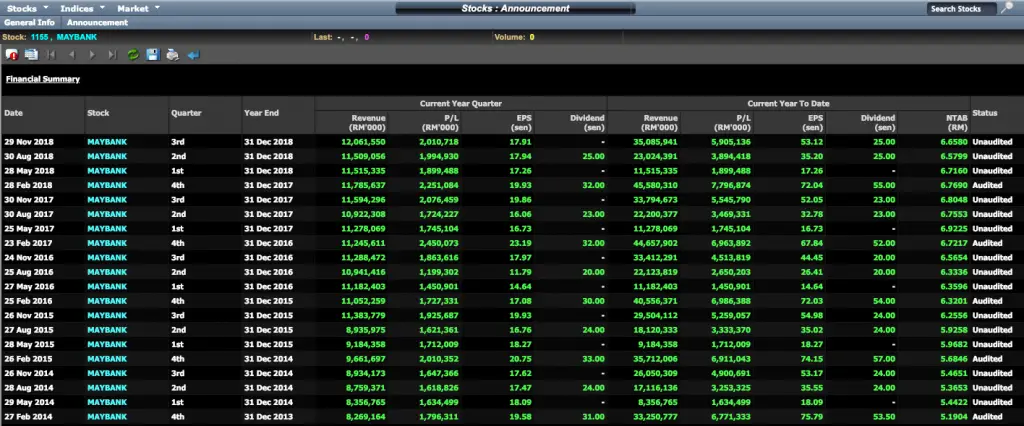
This data is useful when you’re exploring new stocks that you might want to invest in. I look at whether the revenue and profit are growing quarter-on-quarter and year-on-year.
It also gives you an overview on when and how much dividends are being paid out by the company.
Section 5: Financial Ratios
You can also customize the columns on your trading screen for quick access to financial ratios data. I usually look at price per earning (P/E) ratio, dividend yield, earnings per share (EPS) and net tangible assets (NTA) or net asset book value (NAB).
As I write this post, my browser starts acting up so I can’t screenshot how those columns look like but you can find that information on the mobile version of your trading platform as well.
You can also find these details on KLSE Screener as well:
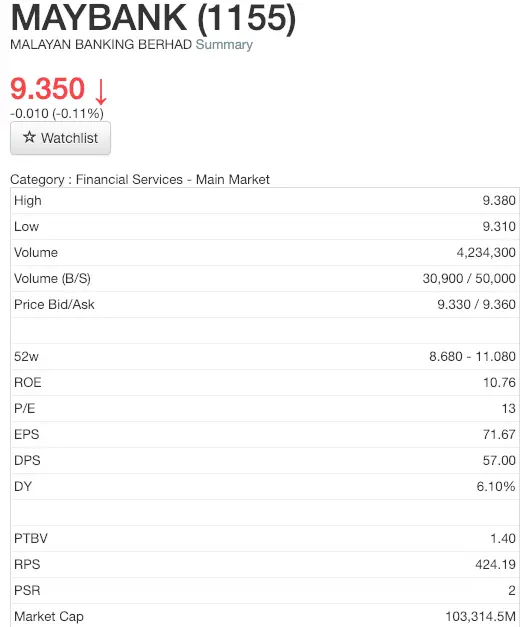
For this particular section, it really helps to learn HOW to read the data and use it to make your investment decisions. There are great free resources to help guide you with this: I recommend starting here and here.
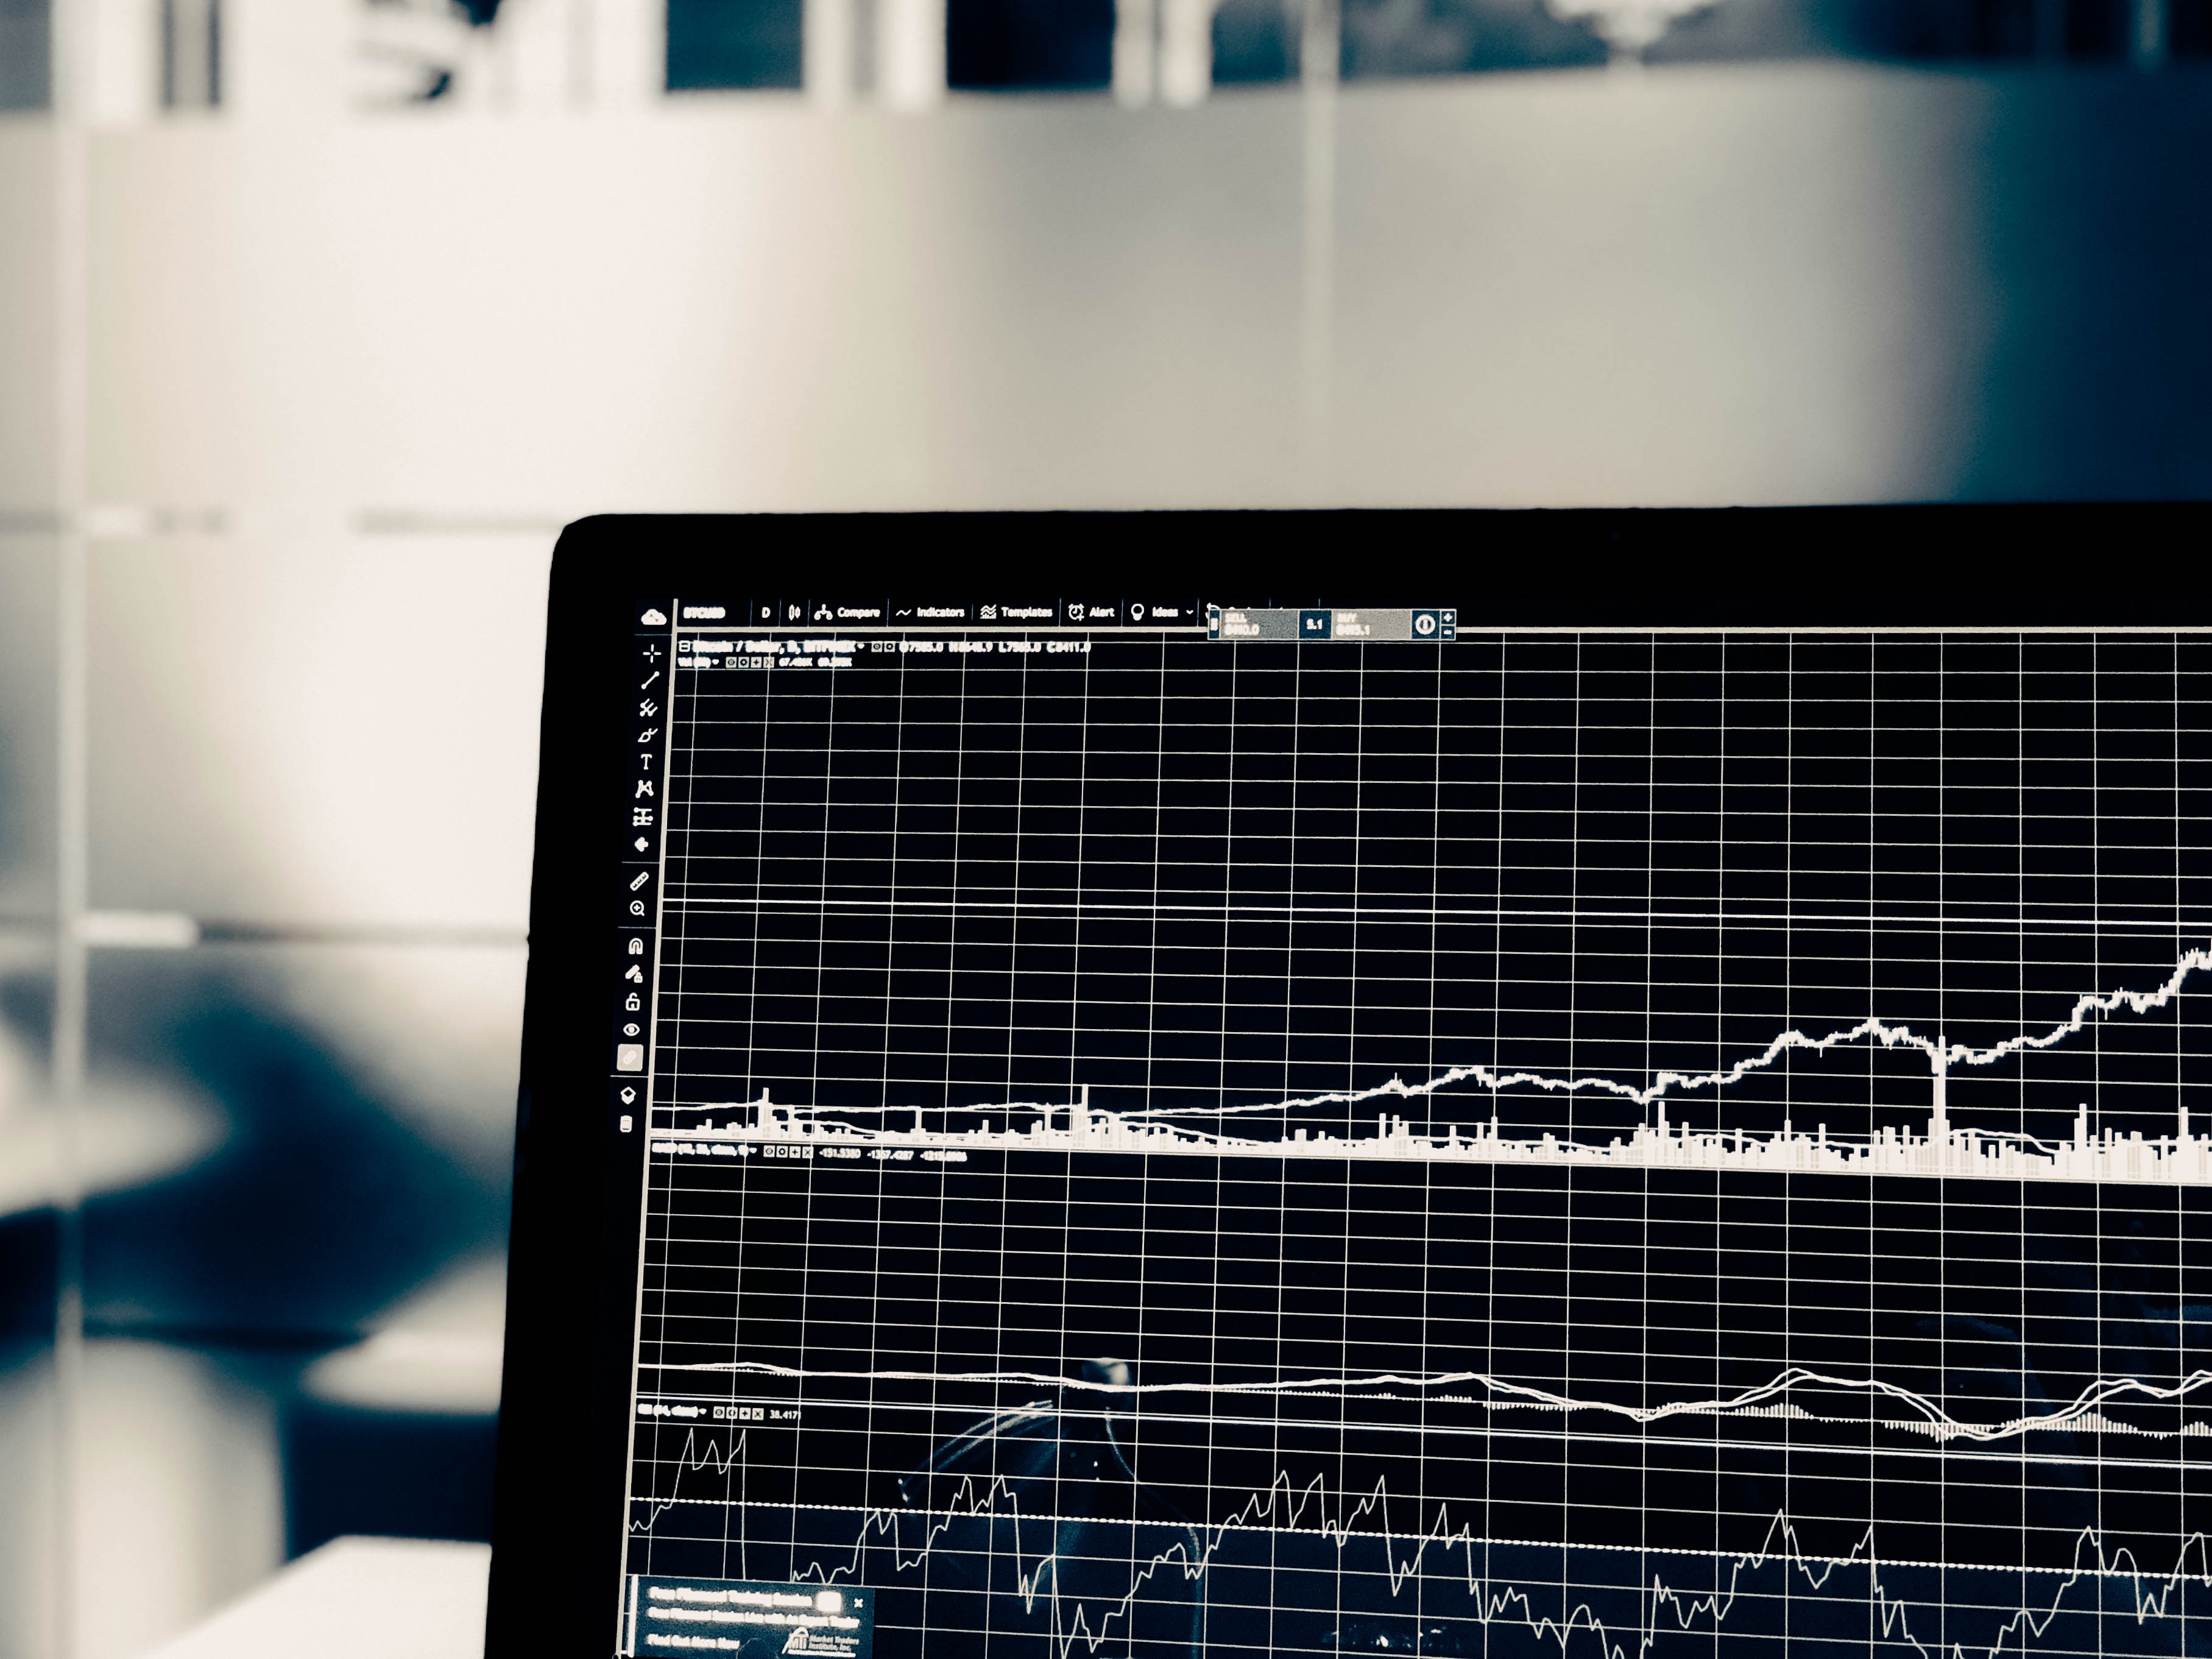
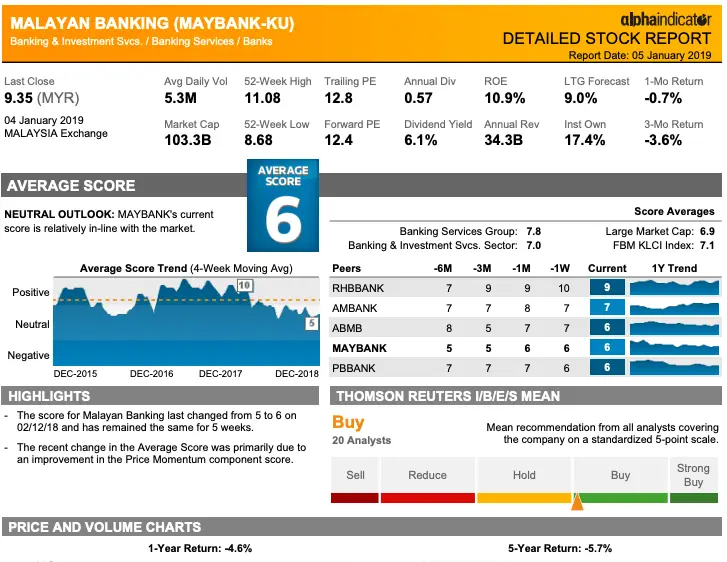
Section 6: Technical Chart
This is my least favorite section to look at mainly because I genuinely SUCK at technical analysis. But I do my best to decipher these graphs. Two things that I learned to pay attention to are: the price trends and volume.
Price trends refer to the shape of the graph. Is it going upwards? Is it going downwards? Or up and down a lot? I look at a trend of a minimum of 6 months up to a year. This is to help gauge which way the price might move in the near future.
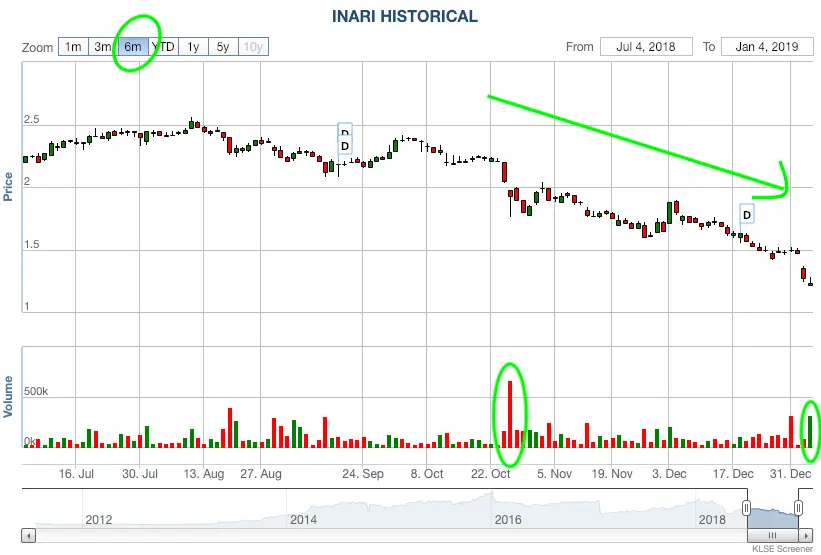
As for volume, it’s more of an indicator of buying or selling interest. High volumes can coincide with recent development for the company. That’s when I go back and look at the announcements and do a quick Google search for news.
By and large, I don’t know how to use any of the other technical tools like Relative Strength Index (RSI), Moving Averages (MA) and other stochastic tools. Theoretically, I know these concepts but I hardly ever apply them to my investing strategies.
If you pick up technical analysis skills, the major advantage you’ll have is: it can help you time the market much better and predict trends with more confidence.
Final Thoughts
This is my basic workflow when it comes to investing in the stock market. There are other tools and techniques I use to supplement my investment decisions such as financial modeling and in-depth fundamental analysis.
But if you’re just starting out, why not tackle the simple things first?
Get your own workflow down, set a routine for yourself on a daily basis to check prices and news.
Just like with any other habits, you become better at it as you keep practicing. You know that saying lah, sikit-sikit lama-lama jadi bukit. And honestly, as I grow older, the truer that saying becomes. Your knowledge and your money will continue to grow as these steps become more habitual.
I hope this guide can ease some of your anxieties about trading and investing.
For the newbies, what other things are holding you back from investing? Those seasoned investors, what sort of workflow have you adopted? Share with me in the comments.
Come have a chat with me on Facebook, Instagram, or Twitter.
Image via Unsplash.